From Candlesticks to Factors: How Modern Quantitative Systems Identify Market Patterns
Many investors are familiar with candlestick patterns—visual formations on price charts that traders have used for decades to interpret short-term market behavior. Patterns such as “engulfing,” “hammer,” or “doji” are often taught as signals of potential reversals or continuation. While these ideas remain intuitive, modern quantitative systems approach the same underlying concepts in a more systematic and testable way through the use of factors.
A factor is simply a measurable characteristic derived from market data, such as price, volume, or volatility. Examples include momentum over a defined period, the distance of price from a recent high or low, changes in volatility, or shifts in trading activity throughout the day. In this sense, factors represent the building blocks of market behavior. Where a candlestick pattern describes a specific visual setup using fixed rules, a factor expresses that same idea numerically, allowing it to be evaluated consistently across time and market conditions.
Traditional candlestick patterns can be thought of as a narrow, hard-coded subset of factors. For example, a candlestick pattern might implicitly rely on assumptions about how large a price move must be, how quickly it occurs, or how it compares to recent trading ranges. In factor-based systems, those assumptions are made explicit through parameters—such as lookback windows, thresholds, or scaling rules—which can be varied and tested rather than fixed in advance. This allows the system to explore a much broader range of pattern configurations than any single chart formation could capture.
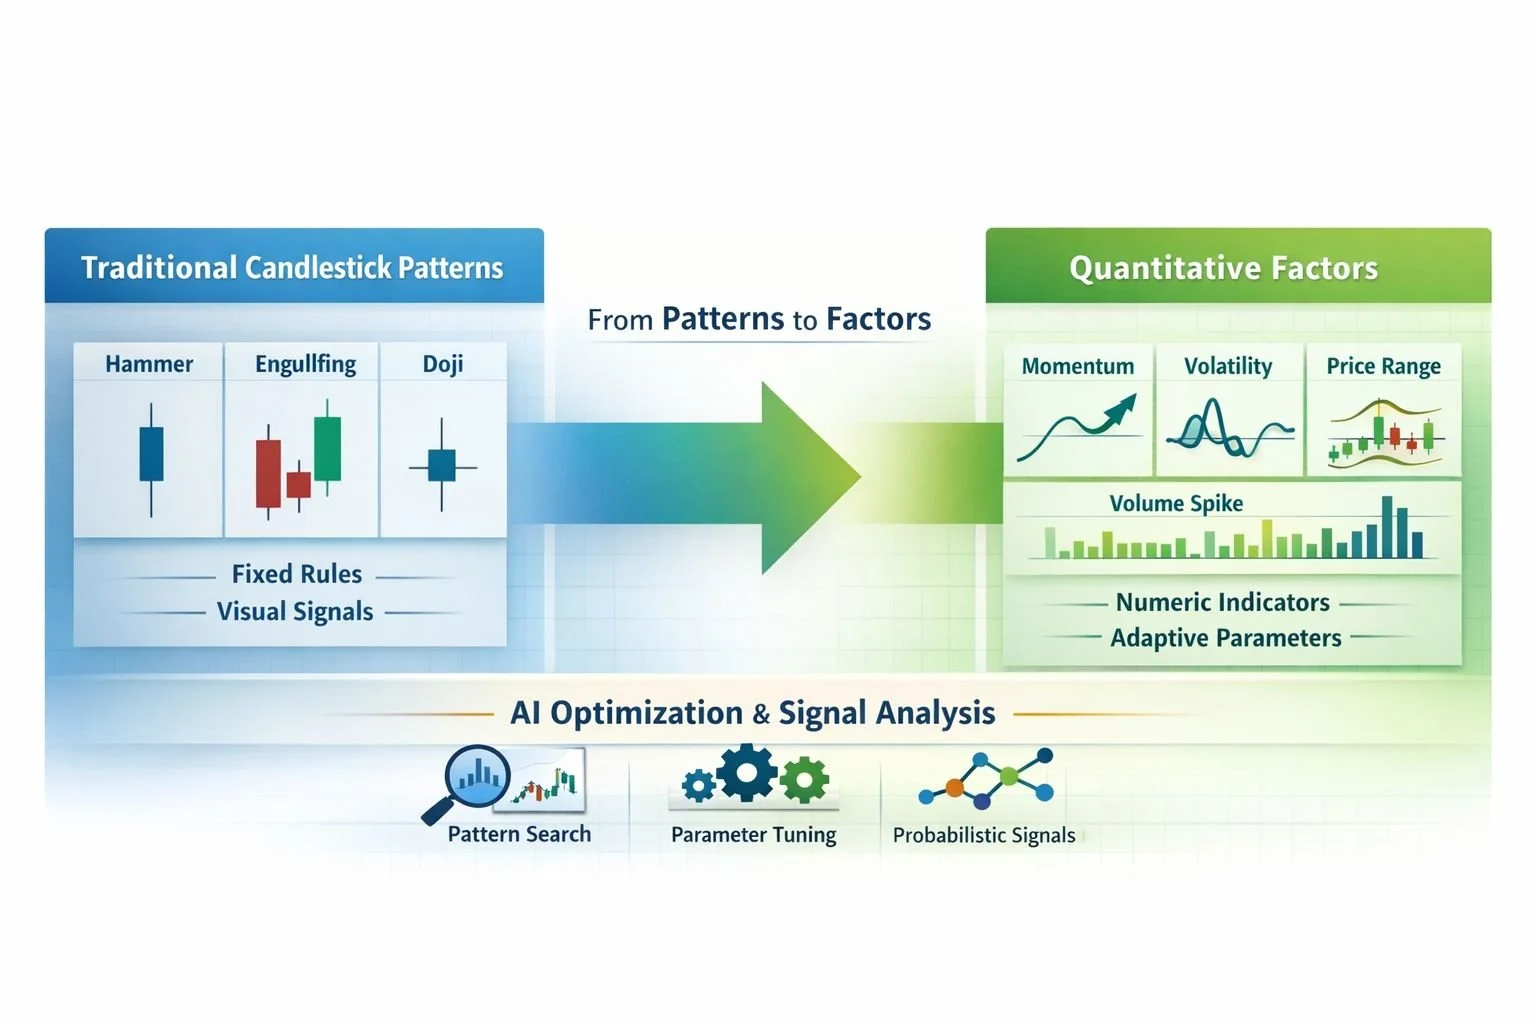
At TTM, factors are not used in isolation or as standalone predictions. Instead, they are evaluated across many parameter combinations to understand how different configurations historically aligned with short-term market behavior. Advanced optimization techniques—often referred to as “AI” in a general sense—are used to efficiently search this parameter space and identify configurations that appear more robust across varying environments. Importantly, this process is focused on pattern discovery and signal calibration, not on forecasting markets or guaranteeing outcomes.
The result is a probabilistic framework rather than a binary one. Instead of declaring that a specific pattern “means” the market will move in a certain direction, the system assesses whether certain conditions have historically been associated with higher or lower probabilities of specific outcomes. These signals are then combined with portfolio context, risk constraints, and execution rules before any investment decision is made. Risk management and suitability remain central considerations throughout this process.
By moving from visual patterns to quantitative factors, modern systems aim to preserve the intuition behind traditional technical analysis while applying statistical discipline, repeatability, and transparency. This approach does not eliminate uncertainty—markets are inherently uncertain—but it provides a structured way to study behavior, test assumptions, and adapt as conditions evolve.
Important Disclosure:
This material is provided for informational and educational purposes only and does not constitute investment advice or a recommendation to buy or sell any security. The concepts described are general in nature and do not guarantee any particular outcome. Actual investment results may differ materially.